 Quick Summary: Trading Slippage Defined
Slippage in trading refers to the discrepancy between the expected price of an order and the actual price at which that trade is executed. It takes place across equities, foreign exchange, commodities, futures, and cryptocurrencies when a market order is filled during periods of fast price movement, or when an order size exceeds the volume available at the immediate top-of-book bid or offer.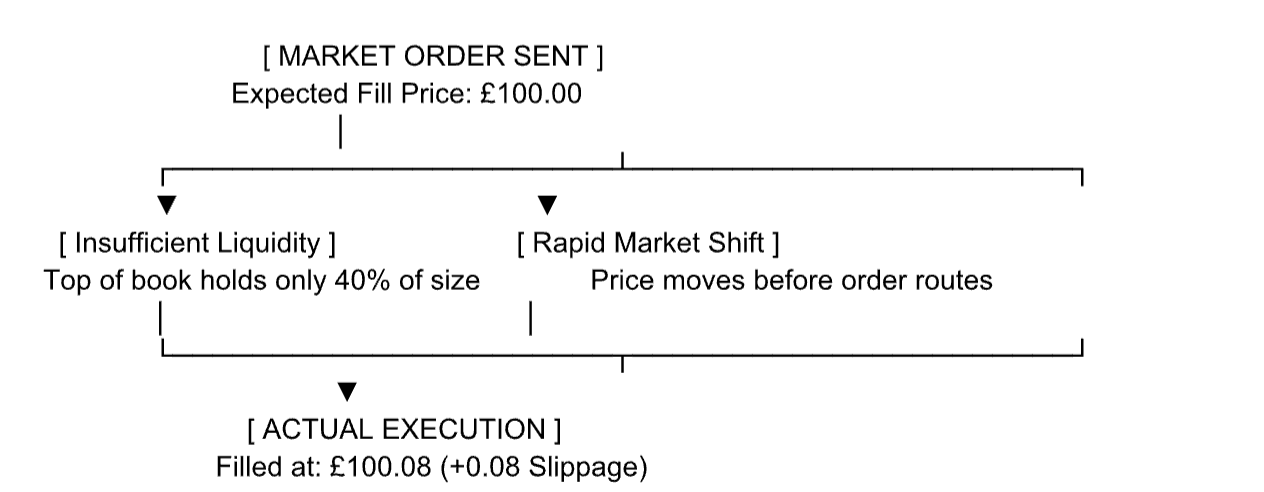
Slippage can be negative (an unfavourable fill cost) or positive (a fill that executes at a more advantageous price than anticipated). Platforms like Bookmap give traders full visual access to resting order book depth, helping them detect thin liquidity zones, track market absorption, and avoid costly execution drag.
Trading Slippage Meaning: Core Definitions and Microstructure
At its core, trading slippage is the variance in cost experienced when crossing the bid-ask spread with a market order. Every active financial exchange runs on a matching engine driven by a continuous double auction or central limit order book (CLOB). Market makers and institutional participants post passive limit orders containing specific prices and quantities, while active traders consume that resting liquidity with aggressive market orders.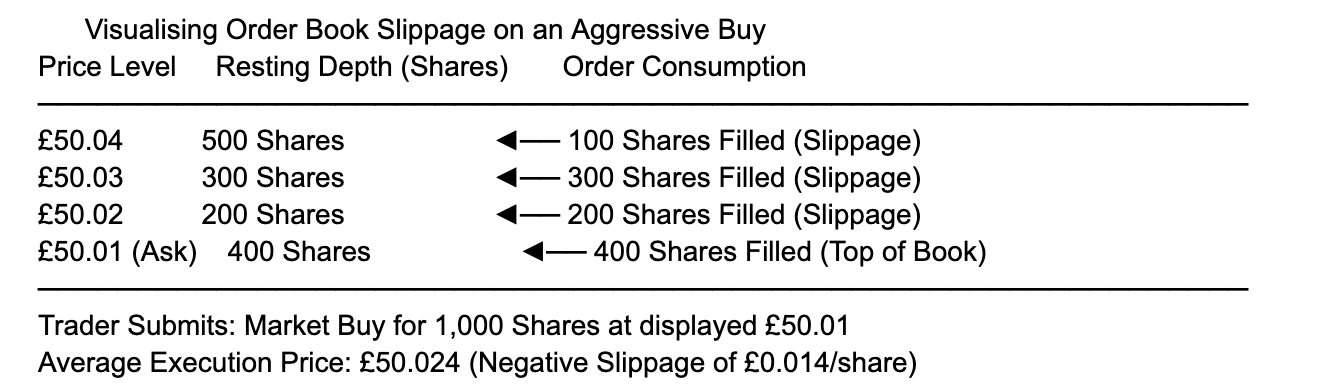
When an aggressive market order enters the exchange, it cannot execute at a singular price if the total order size is larger than the volume resting at the current best ask (for buys) or best bid (for sells). The matching engine sweeps up or down through successive price tiers on the book until the entire order is filled. This mechanical sweep of resting depth is the primary driver of execution slippage.
Difference Between Expected and Executed Trade Price: The Anatomy of a Fill
The gap between expectation and reality during trade entry breaks down into three distinct intervals:
- Decision Time: The moment a trader analyses a chart and triggers an order at the displayed quote.
- Transmission Latency: The milliseconds required for the electronic signal to travel from the local terminal, through broker infrastructure, across Smart Order Routers (SORs), and into the exchange matching engine.
- Execution Time: The physical matching of the order against resting counterparty volume inside the matching engine.
If the market’s liquidity changes or quotes shift during stages 2 and 3, execution price variance occurs. While a fraction of a penny or a single tick may appear negligible on a retail lot, cumulative execution drag across high-frequency or institutional strategies can erode overall profitability.
Order Execution Price Variance Explained: Why Fills Diverge
Price variance between submission and execution stems from three core market conditions:
- Liquidity Voids: When resting depth on the order book is thin, even modest market orders deplete the top tier, sweeping deeper into the book to find fills.
- Momentum Shifts: During major macroeconomic announcements (such as UK CPI prints or US Federal Reserve rate decisions), orders arrive simultaneously. Prices move faster than network packets can update displayed quotes.
- Exchange Latency: Queuing delays inside exchange matching engines mean that by the time an order matches, earlier priority orders have already taken the resting shares.
Using high-definition market depth tools like Bookmap allows traders to spot liquidity voids before committing capital, avoiding thin books where execution variance is highest.
How Slippage Works in Financial Markets: The Matching Engine Process
Every modern electronic exchange enforces strict order-priority mechanics: Price-Time Priority (FIFO) or Pro-Rata Allocation.
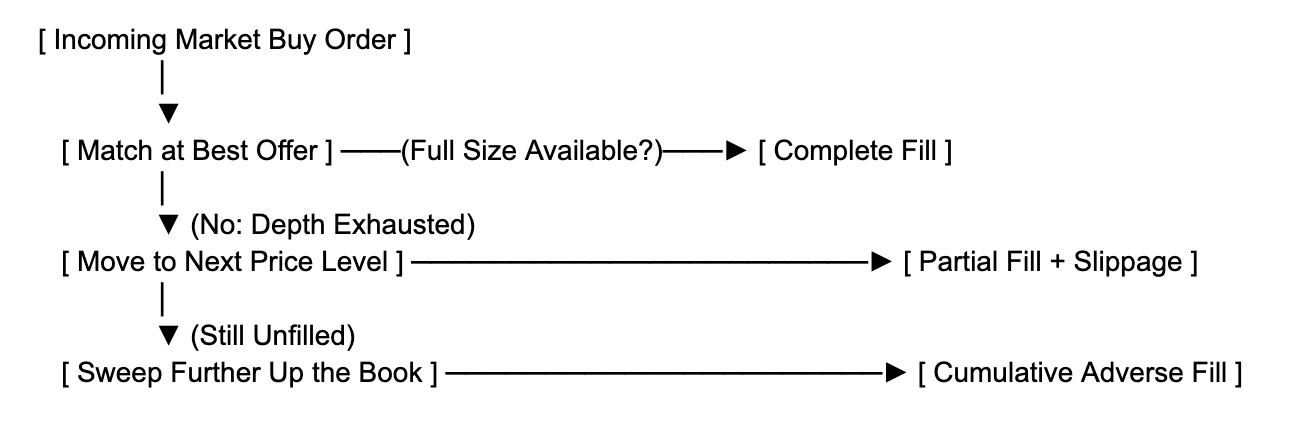
When a trader submits an unpriced market order, they give the exchange engine permission to fill the contract at any price necessary to complete the requested volume. If the best offer contains 20 contracts and the trader sends an order for 50, the initial 20 execute at the initial price, while the remaining 30 sweep higher into resting offers. This lifts the average volume-weighted execution price away from the quote seen on screen.
Positive vs Negative Slippage Examples: Real-World Scenarios
Slippage works both ways. The direction depends on market velocity relative to order direction:
Negative Slippage Scenario (Long Entry)
A day trader observes stock ABC trading at a National Best Bid and Offer (NBBO) of £25.10 / £25.12.
- The trader clicks “Buy Market” for 2,000 shares, expecting a fill at £25.12.
- A simultaneous institutional buy sweep clears all liquidity at £25.12 and £25.13 before the order reaches the engine.
- The order executes at £25.15.
- Outcome: The trader experiences negative slippage of £0.03 per share, increasing trade cost by £60.00.
Positive Slippage Scenario (Short Exit)
A futures trader issues a limit order with price improvement enabled, or a market sell order during an immediate bid surge.
- The trader submits an order to sell 5 E-mini S&P contracts when the bid is 5,000.25.
- Before arrival at the exchange engine, a large resting buy limit flashes onto the book at 5,000.50.
- The sell order matches against the newly posted higher bid.
- Outcome: The trader gains positive slippage of 0.25 points (£12.50 per contract), improving total net profit.
Slippage Tolerance Settings in Decentralized Crypto Exchanges
In decentralised finance (DeFi), automated market makers (AMMs) like Uniswap determine prices algorithmically using constant product formulas () rather than matching engines. Because on-chain transactions sit in a public mempool before block confirmation, crypto trades are vulnerable to execution delays and automated Maximal Extractable Value (MEV) arbitrage bots.
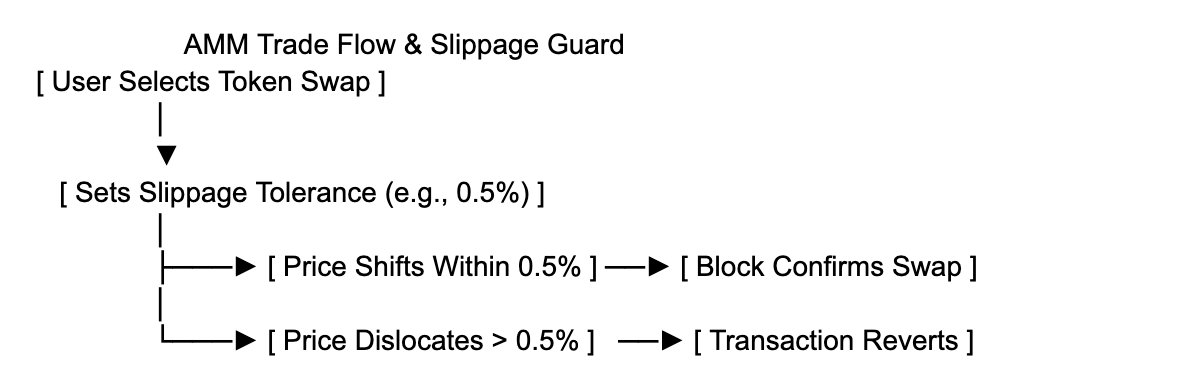
Setting a custom slippage tolerance instructs the underlying smart contract to abort and revert the transaction if the spot price moves beyond a defined threshold (e.g., 0.5% or 1.0%). While loose tolerance limits execution failures, it exposes the trade to predatory “sandwich attacks”, where MEV bots front-run and back-run the transaction to capture the price differential.
Forex Broker Spread Widening and Weekend Slippage
Retail foreign exchange markets operate over-the-counter (OTC) without a single central clearinghouse. Execution relies on broker liquidity pools and tier-1 interbank quote providers.
Traders encounter significant slippage in forex during specific market windows:
- The 22:00 GMT Rollover: As New York closes and Tokyo opens, tier-1 interbank desks reset credit lines, resulting in wider spreads and thinned order books.
- Economic Releases: News events like US Non-Farm Payrolls trigger instantaneous quote withdrawals from institutional market makers.
- Weekend Gaps: Holding open positions through Friday evening exposes capital to geopolitical events over the weekend. Stop-loss orders resting at 1.2500 may fill at 1.2420 on Sunday night if the market opens with a gap, resulting in substantial negative slippage.
Latency Slippage in High Frequency Trading Algorithms
In institutional algorithmic execution, slippage is measured in microseconds ($\mu\text{s}$) and nanoseconds (). High-frequency trading (HFT) firms invest heavily in colocation, custom FPGA hardware, and microwave networks to minimise latency slippage.
When prices shift across multiple exchanges, cross-market arbitrage algorithms race to clear stale quotes on secondary bourses. An algorithm operating with a 15-millisecond latency profile consistently experiences negative latency slippage compared to an execution desk colocated within the exchange data centre operating under 500 nanoseconds.
Order Execution Quality Factors: Sizing, Speed, and Routing
Order execution quality is shaped by several structural factors:
| Execution Factor | Low-Slippage Environment | High-Slippage Environment |
| Market Liquidity | Deep limit order books, high continuous volume | Fragmented or illiquid issues, penny stocks |
| Order Sizing | Trade size represents < 1% of top-of-book depth | Order sweeps multiple tiers of the order book |
| Market Volatility | Stable, range-bound pricing regimes | Major economic data releases or breaking headlines |
| Routing Architecture | Direct Market Access (DMA) to exchange engines | Payment for Order Flow (PFOF) with internalisers |
| Order Type | Limit, Limit-if-Touched, or Midpoint Pegs | Unprotected Market Orders, Stop-Loss Market Orders |
Tracking real-time depth before sending an order helps identify whether current order book conditions will absorb the intended size cleanly.
Hidden Costs of Trading Financial Markets: Friction Beyond Commission
Many modern brokerages advertise zero-commission trading models. However, trading costs extend well beyond explicit fees: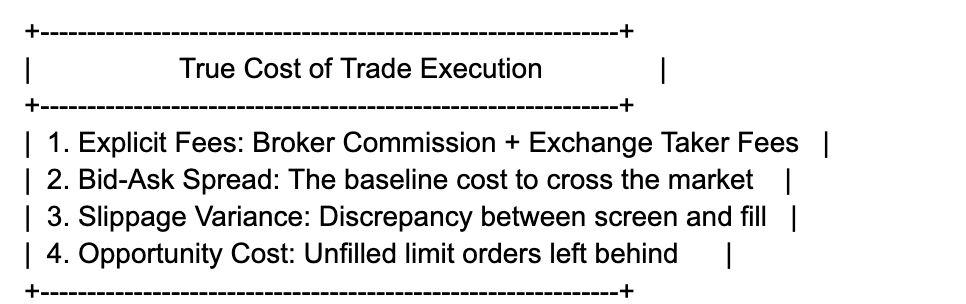
Unmanaged slippage often exceeds explicit brokerage commissions over a trading month. A day trader executing twenty contracts daily and losing an average of a single tick to slippage per round trip incurs thousands of pounds in annual friction, directly eroding net returns.
Market Microstructure and Transaction Cost Analysis (TCA)
Institutional asset managers utilize Transaction Cost Analysis (TCA) to evaluate execution efficiency. TCA models dissect every order into discrete components:
By measuring realized execution prices against benchmark metrics like Volume-Weighted Average Price (VWAP) or Arrival Price, algorithmic trading desks quantify slippage accurately. When TCA identifies consistent negative slippage across specific routing destinations, routing desks adjust their Smart Order Routers (SORs) to redirect flow toward deeper alternative venues or dark pools.
Top 5 Ways Professional Traders Prevent Order Slippage
- Trade with Limit Orders: Avoid naked market orders. Use limit orders to define the absolute maximum or minimum price accepted for execution.
- Visualise Hidden Market Depth: Monitor resting limit orders on an order book heatmap. Platforms like Bookmap show whether a level has genuine backing or is vulnerable to an immediate liquidity sweep.
- Avoid Volatile News Catalysts: Step aside 5 minutes before and after scheduled high-impact economic data releases to avoid widened bid-ask spreads and liquidity pullbacks.
- Use Market-on-Touch (MIT) or Pegged Orders: Midpoint peg orders capture inside liquidity without crossing the full spread, reducing execution friction.
- Split Large Orders into Slices: Divide sizable positions into smaller child clips using VWAP or iceberg order strategies to avoid clearing out resting book depth.
Why Choose Bookmap: Precision Liquidity Visualisation
Traditional charting platforms flatten tick data into static candlestick bars, obscuring the order book activity beneath price movement. Bookmap changes this by rendering full Level 2 and Level 3 market depth into a continuous, real-time visual heatmap.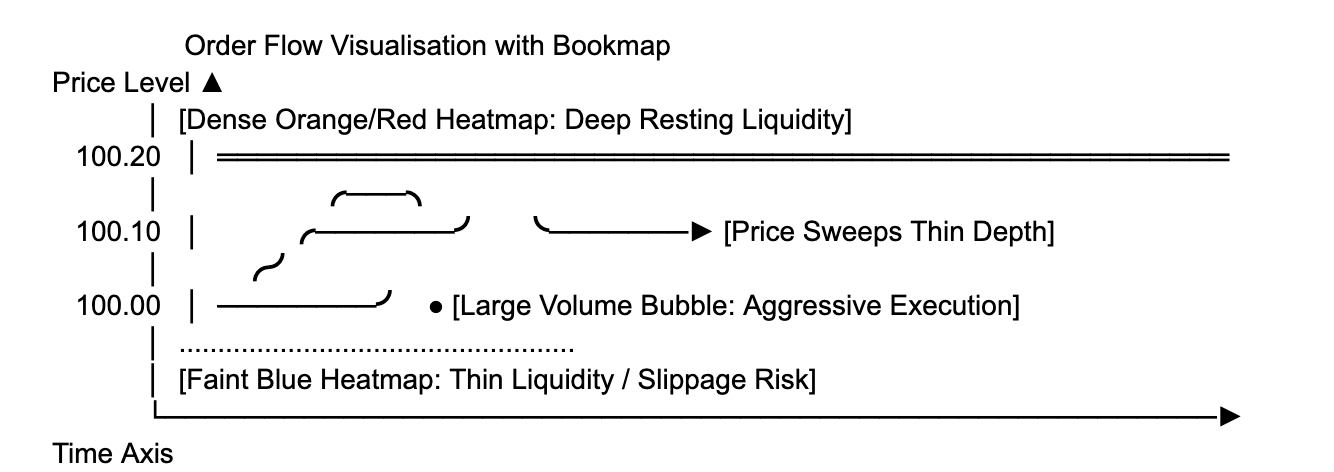
Bookmap renders resting limit orders as a dynamic, colour-coded heatmap. Strong liquidity shelves appear in bright orange and red bands, while thin liquidity voids show up as deep blue areas. Spotting these zones in advance helps you avoid market orders into thin books where slippage is highest.
Dynamic Volume Bubbles
Bookmap plots every executed transaction as a sized Volume Bubble right on the price timeline. Green indicates aggressive buying, red highlights aggressive selling, and bubble size scales directly with trade volume. This makes it easy to confirm whether an institutional block trade has absorbed the market or swept the spread.
Clear Algorithmic Footprints
Track institutional iceberg orders, spoofed liquidity, and stop-loss cascades as they happen. Bookmap reveals passive limit orders that refill dynamically, helping you avoid false breakouts and enter trades with clearer execution targets.
High-Performance Data Architecture
Engineered to process tens of thousands of market depth updates per second without freezing or lagging, Bookmap delivers the low-latency visibility active traders need. Backed by an “Excellent” rating on Trustpilot, Bookmap is a trusted platform for retail and institutional traders globally.
Bookmap Pricing and Access Options
Bookmap offers flexible plans suited for crypto enthusiasts, futures scalpers, and active multi-asset equity traders worldwide.
| Plan Tier | Monthly / Annual Pricing | Supported Asset Classes | Core Features Included |
| Digital | Free ($0) | Cryptocurrencies (Real-time) | Base heatmap display, live crypto connections, dynamic volume bubbles. |
| Digital+ | $19/mo (or $16/mo billed annually) | Cryptocurrencies | Advanced crypto data feeds, custom indicators, extended depth view. |
| Global | $49/mo (or $39/mo billed annually) | Stocks, Futures, Crypto | Full Level 2 depth visualisation, multi-asset data routing, audio alerts. |
| Global+ | $99/mo (or $79/mo billed annually) | Stocks, Futures, Crypto | Full Level 3 market data, automated iceberg detection, Cumulative Volume Delta, API access. |
Note: Real-time stock and futures market data connections (e.g., CME, Eurex, Nasdaq, dxFeed) are connected directly via supported brokerages or purchased as separate third-party data subscriptions.
Comparing Execution Platforms: Standard Candlesticks vs Bookmap Heatmaps
Evaluating execution quality requires matching software tools to market complexity:
| Feature / Metric | Traditional Candlestick Platforms | Level 2 Matrix / DOM Ladders | Bookmap Visual Heatmap |
| Order Book Depth History | None (Past candles delete depth) | None (Shows only current instant) | Full historical visualization across past sessions |
| Liquidity Void Identification | Invisible until candle closes | Challenging to calculate across flashing numbers | Visually apparent via colour-coded depth contrast |
| Iceberg Execution Tracking | Hidden | Difficult to spot in real time | Automatically calculated and highlighted on chart |
| Slippage Risk Assessment | Highly subjective | Requires manual arithmetic | Visible directly via heatmap density profiles |
Take Control of Your Order Execution Today
Stop guessing where your market orders will fill. Visualise the limit order book, spot liquidity voids, and execute with confidence.
- [Get Started with Bookmap for Free] — Access real-time crypto order book heatmaps instantly.
- [Book a Platform Demo Consultation] — See how Bookmap tracks market depth and reduces execution drag.
- [Speak to a Market Data Expert] — Find the best data feed and connectivity setup for your asset class.
Slippage in Trading FAQ: Key Market Questions Answered
How to prevent negative slippage on market orders?
The most reliable way to prevent negative slippage is to replace market orders with limit orders or marketable limit orders. A marketable limit order includes an explicit price cap (for buys) or floor (for sells), ensuring the trade fills only at the chosen price or better. Additionally, avoid submitting aggressive orders immediately before or during high-impact news releases, and trade assets with thick order book depth.
Does slippage happen with limit orders?
Standard limit orders do not experience negative slippage. A buy limit order guarantees an execution at the specified limit price or lower, while a sell limit order guarantees execution at the limit price or higher. However, limit orders carry execution risk (the risk of not filling at all if the market moves away). The exception is stop-loss limit orders, which trigger a limit order once the stop price is hit; if the market gaps past the limit price, the order remains resting and unfilled.
What causes slippage in highly volatile markets?
In volatile markets, two factors cause slippage:
- Quote Depletion: Rapid market buying or selling quickly cleans out resting limit orders, leaving gaps between price levels on the book.
- Quote Revision Latency: High volatility leads market makers to widen spreads and pull passive liquidity to avoid adverse selection. As depth thins, incoming market orders must sweep further down the order book to fill their full size.
How to calculate slippage percentage in day trading?
Calculate slippage percentage using this formula:
$$\text{Slippage \%} = \left( \frac{\text{Actual Execution Price} – \text{Expected Price}}{\text{Expected Price}} \right) \times 100$$
For example, if you place a market buy order expecting a fill at £50.00, but execution confirms at £50.10:
$$\text{Slippage \%} = \left( \frac{50.10 – 50.00}{50.00} \right) \times 100 = 0.20\%$$
On a £10,000 position, that 0.20% slippage represents a £20 execution cost.
Are you trading crypto decentralized exchanges, forex, or traditional stocks?
Slippage mechanics differ across these asset classes:
- Decentralised Crypto (DEXs): Slippage is governed by AMM pool mathematical formulas (), blockchain block times, gas auction priorities, and MEV sandwich risks.
- Forex: Driven by broker interbank liquidity feeds, liquidity rollover windows, and weekend gap risk.
- Traditional Equities & Futures: Governed by central limit order books, exchange matching engines, and Level 2/Level 3 depth availability.
Using Bookmap, you can monitor order book depth across futures, equities, and crypto from a single, unified interface.
Are you looking for the theoretical definition or strategies to reduce it?
- Theoretical Definition: Slippage is the difference between an order’s expected price and its ultimate fill price, caused by latency, spread traversal, and depth depletion.
- Actionable Strategies to Reduce It: To minimise slippage, trade during peak market hours when volume is highest, route orders through Direct Market Access (DMA) brokers, use midpoint pegged orders, and visualise real-time resting depth with order book heatmaps.
Do you need guidance on configuring slippage tolerance in your platform?
Most trading software and crypto DEX interfaces allow users to set explicit slippage tolerance boundaries:
- DEX Protocols (e.g., Uniswap): Set tolerance between 0.1% and 0.5% for liquid pairs (like ETH/USDC) to protect against front-running bots, or 1.0% to 3.0% for low-liquidity tokens to prevent failed transactions.
- Direct Broker Terminals: Enable limit-price buffers on market-order shortcuts or switch default order entry hotkeys from “Market” to “Limit (Join Bid/Offer)” or “Marketable Limit (1-Tick Offset)”.